A recent supply chain attack was performed against HWMonitor porgram, replacing the legitimate one with malicious version. The attack leverage Dll sideloading technique.
A malicious “CRYPTBASE.dll” was placed in the same folder of the program.CRYPTBASE.dll is a legitimate windows dll and normally is placed in “C:\Windows\System32”
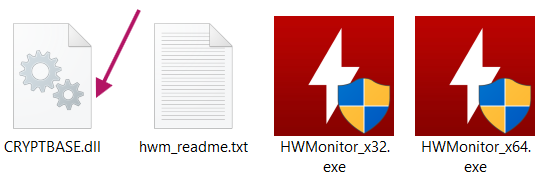
malicious cryptbase.dll
Looking at the dllmain of the malicious dll →
1-the program obtain the threaId for later use
2-loads the legitimate dll from “C:” partition, ensuring that the normal program is not interrupted
3-creating a thread, starting execution of malicious function (”StartAddress” as labeled by IDA).
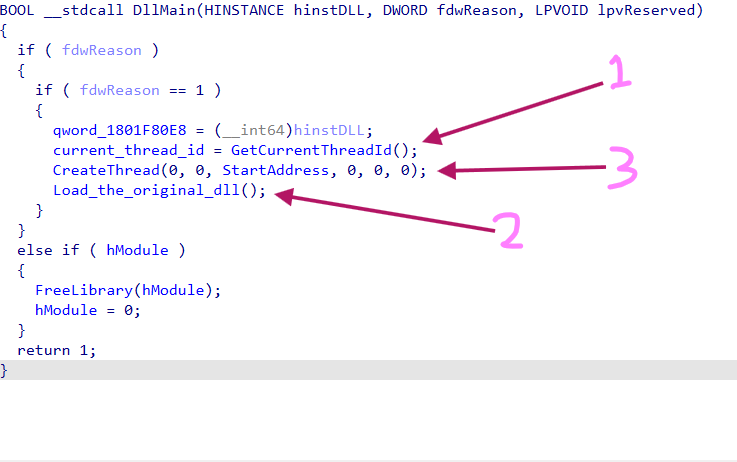
DllMain
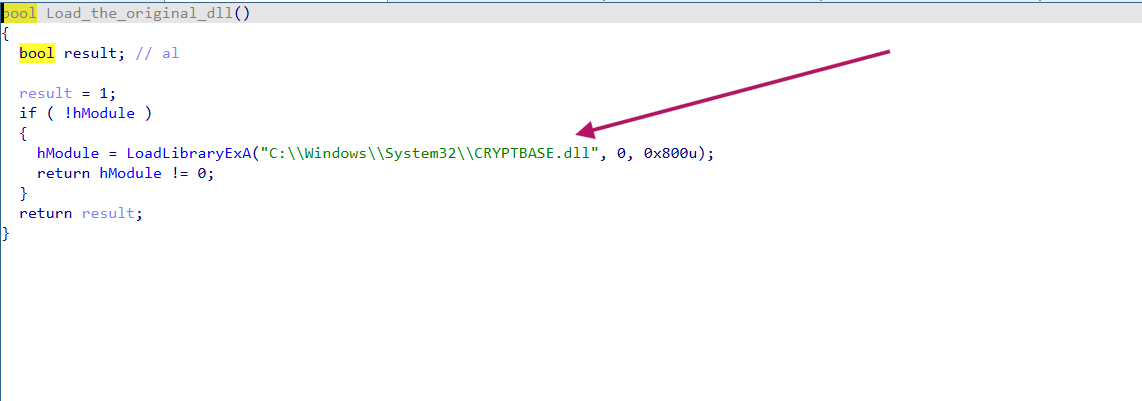
Loading the original Dll
The function suspends the main thread, then calls CreateThread api again passing a new address to start execution from there. and then resume the main thread after finishing, proceeding to load_the_original_dll functions that load the legitimate dll as i said.
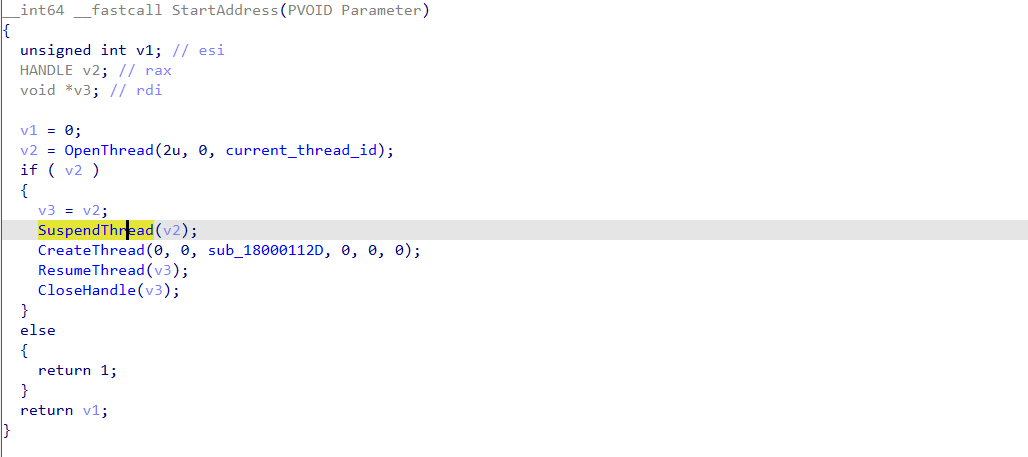
StartAddess function
the sub_18000112D function move a large data, doing some operations and as noticed here, we see the usage of typical virtualAlloc api to allocate space in the process memory (1), and a large volume movement of the data to the location allocated (2).
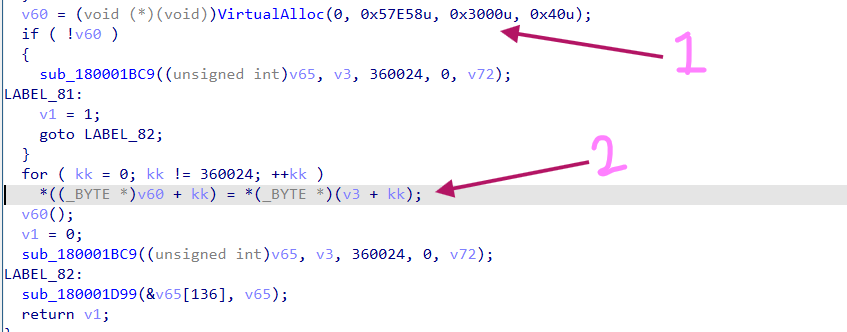
sub_18000112D
From here and now we will be using x64dbg to unpack the coming multistage payload delivery chain and extract the final stage.
We break on VirtualAlloc

upon hitting it, we trace the function until it returns and follow the RAX register which contains a pointer to the allocated memory space.
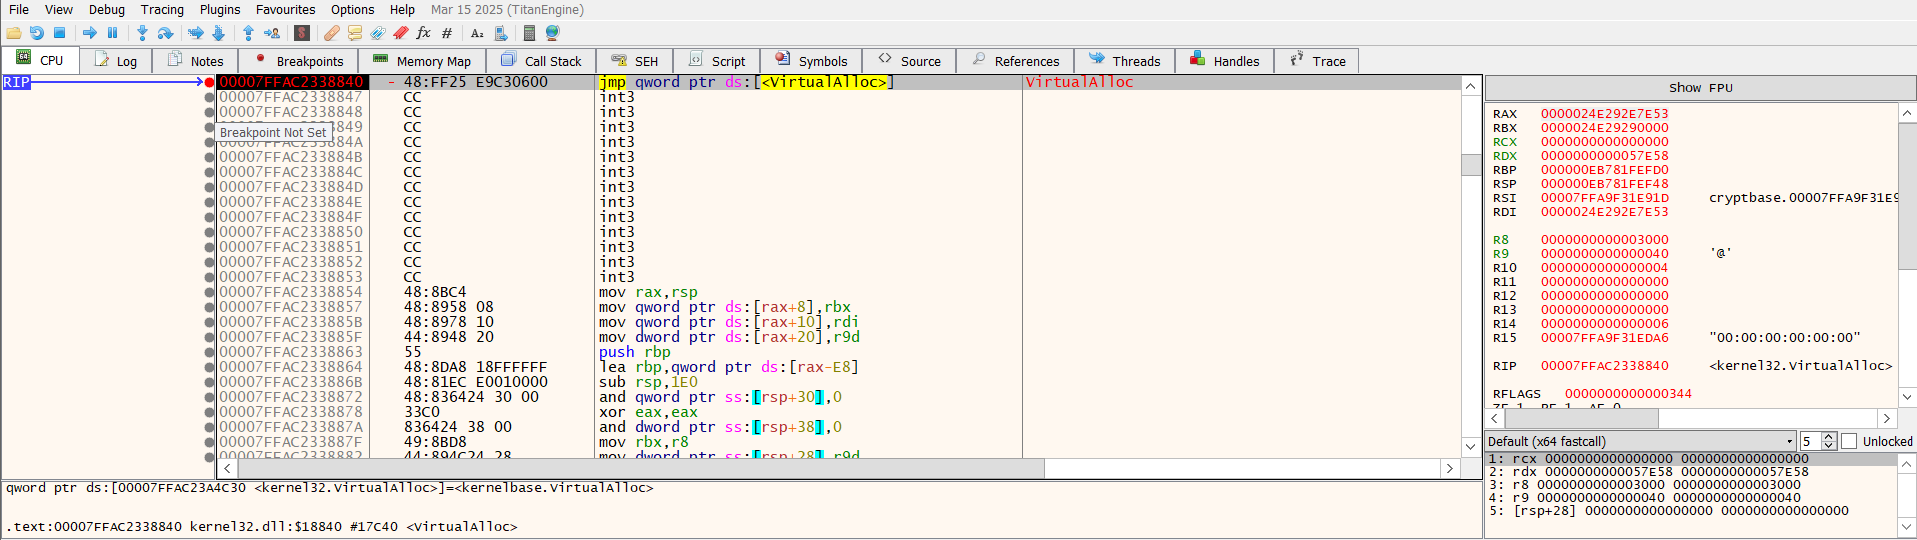
VirtualAlloc Hit
Following that, we can identify the part of the program that copies the second stage data.
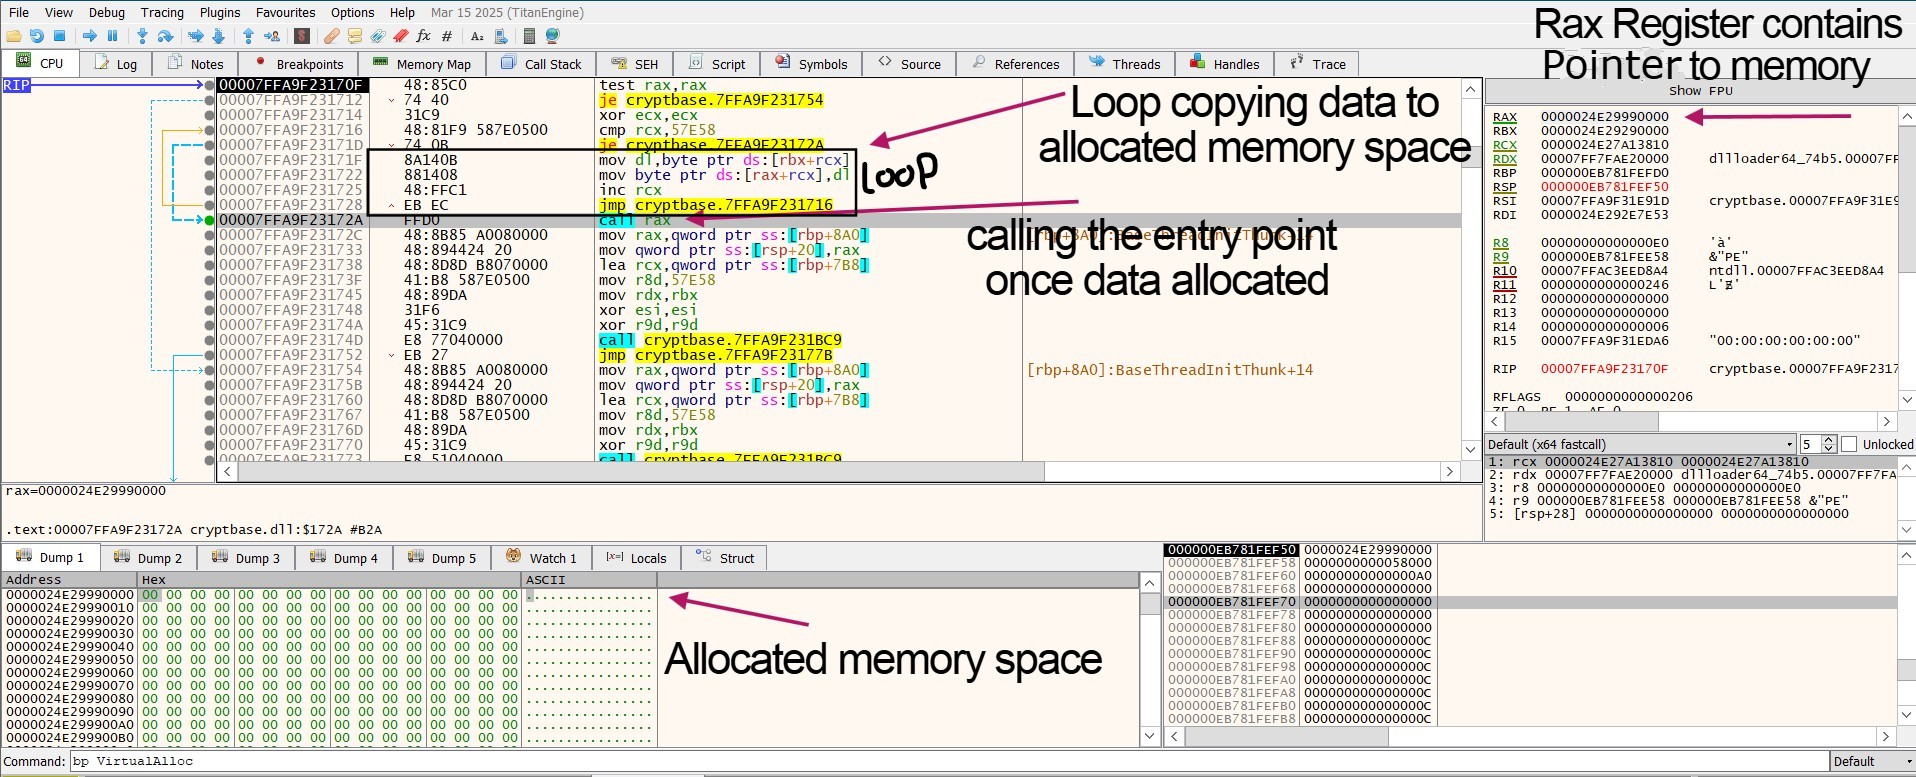
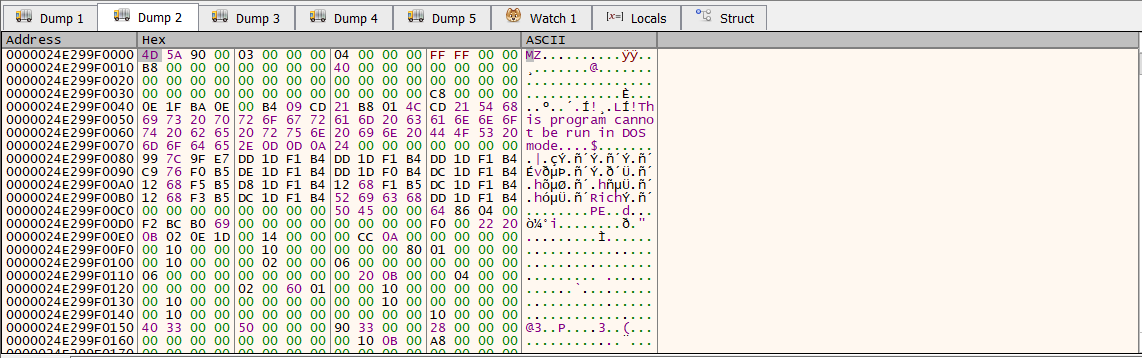
After letting the loop finishes, the second stage uncover with shellcode and PE file allocated.
As expected, the shellcode is position independent. the shellcode gets its position using call/pop technique. and then preparing RCX,RDX registers with some configuration data and base address of the PE file respectively.
RBX contains the relative address inside the PE file which the program will start executing.
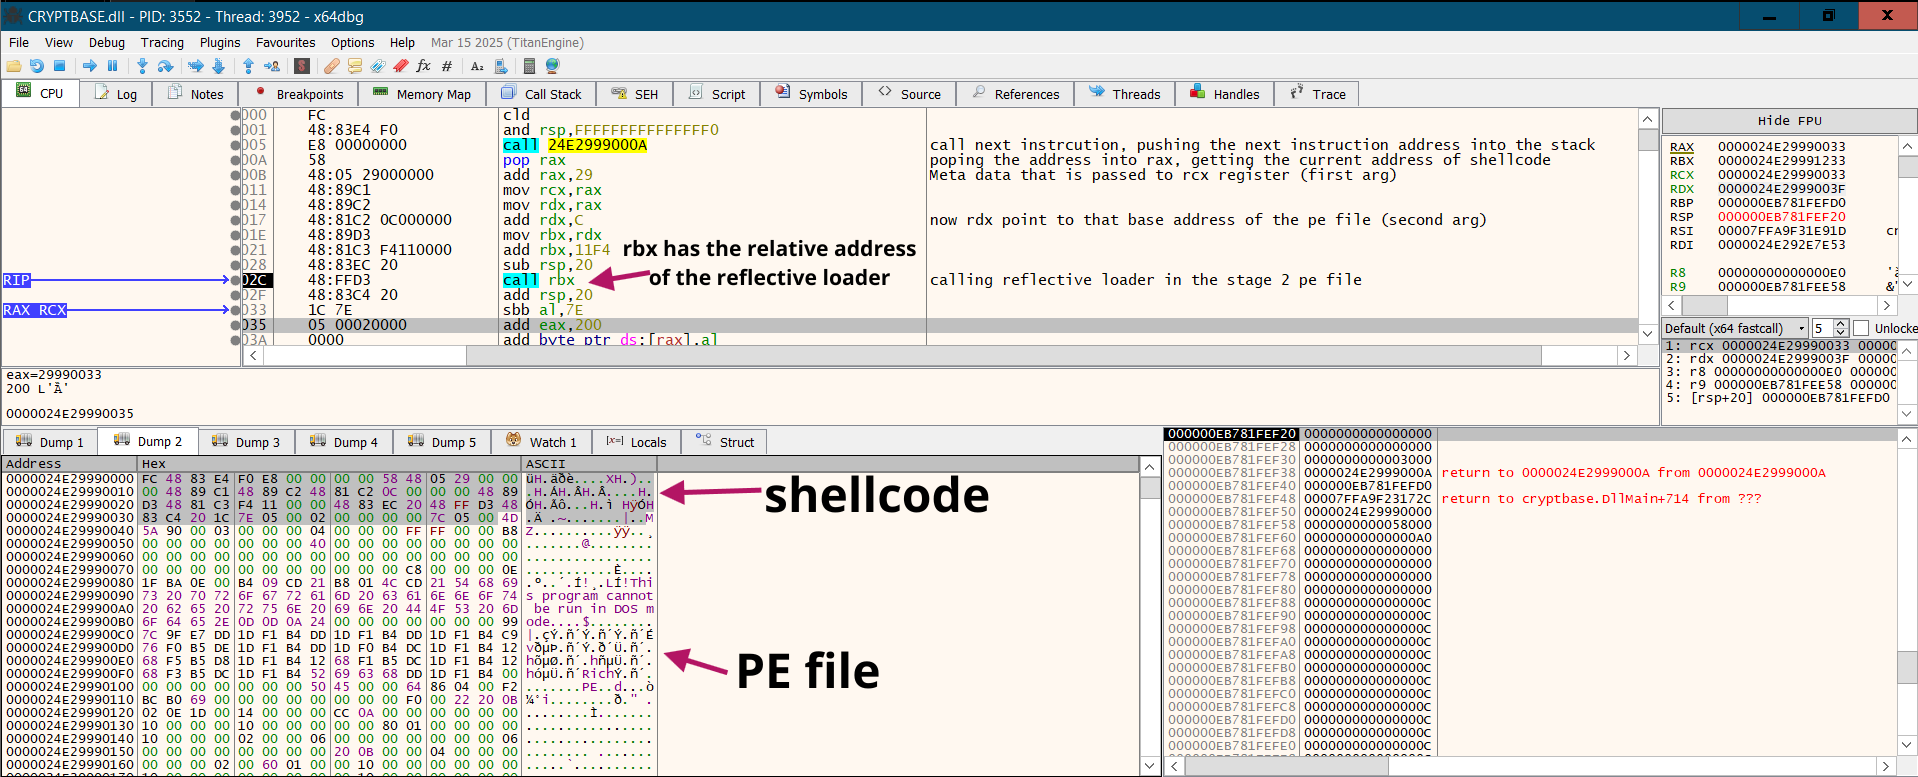
Second Stage Allocated data ⇒(shellcode+PE file)
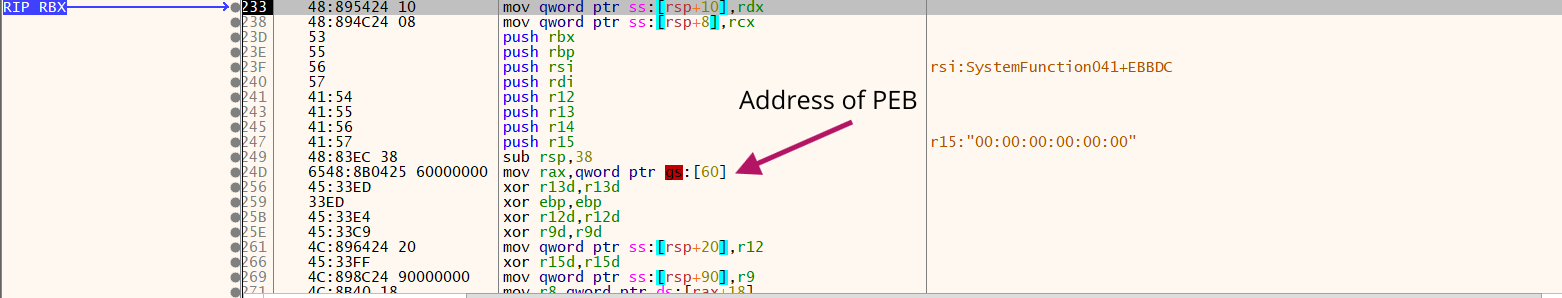
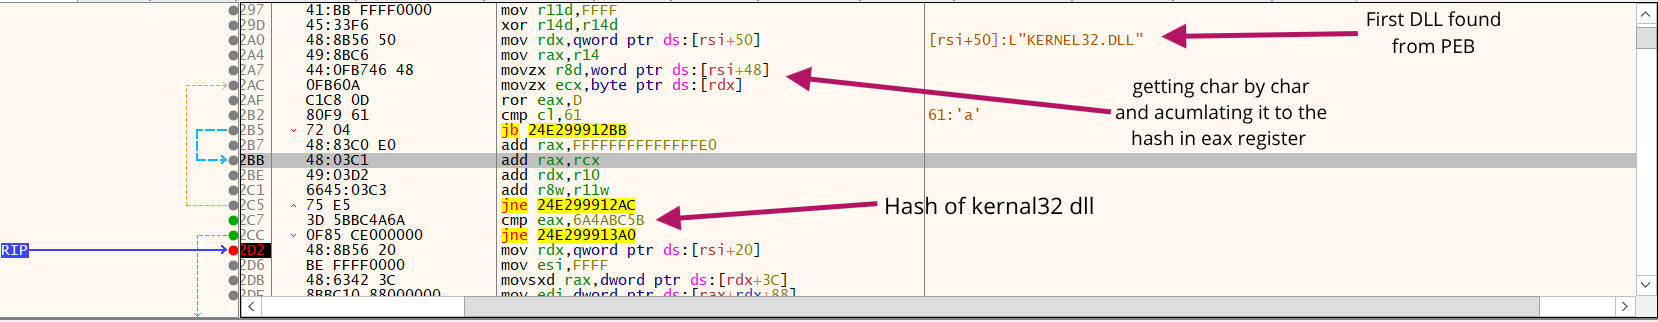
the code we jumped to is identified as reflective loader, as we see the code is getting the PEB data structure, as a way to obtain the base address of some dlls like kernal32 and functions like TerminateProcess,GetProcAddress,VirtualAlloc,ExitProcess using hashing.
after continuing execution, we hit another VirtualAlloc after we got dlls,functions addresses.
We continue execution until we found many occurring tail jmp to entry point of the allocated PE file.
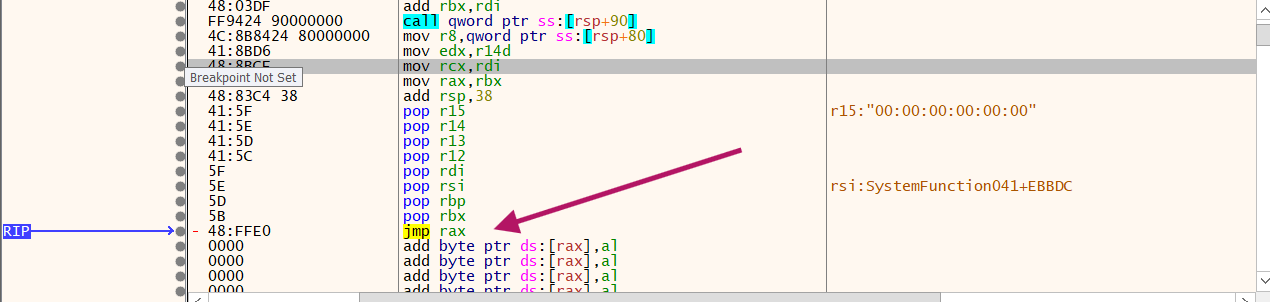
Tail Jump
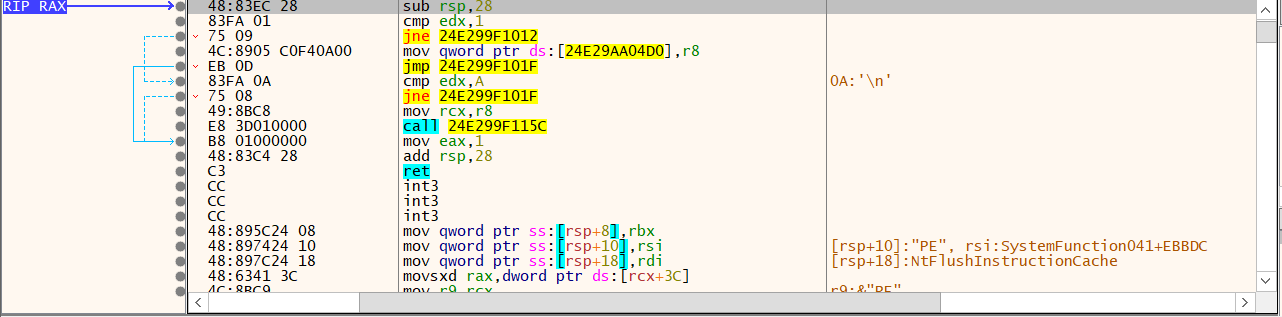
Entry Point
By continuing execution, we hit multiple VirtualAlloc calls. This occurs because the reflective loading process must allocate memory for various PE sections, resolve dependencies, and handle image base relocations. By tracing the most recent memory allocation, we successfully identified the final stage of the STX RAT, fully decoded and resident in memory.
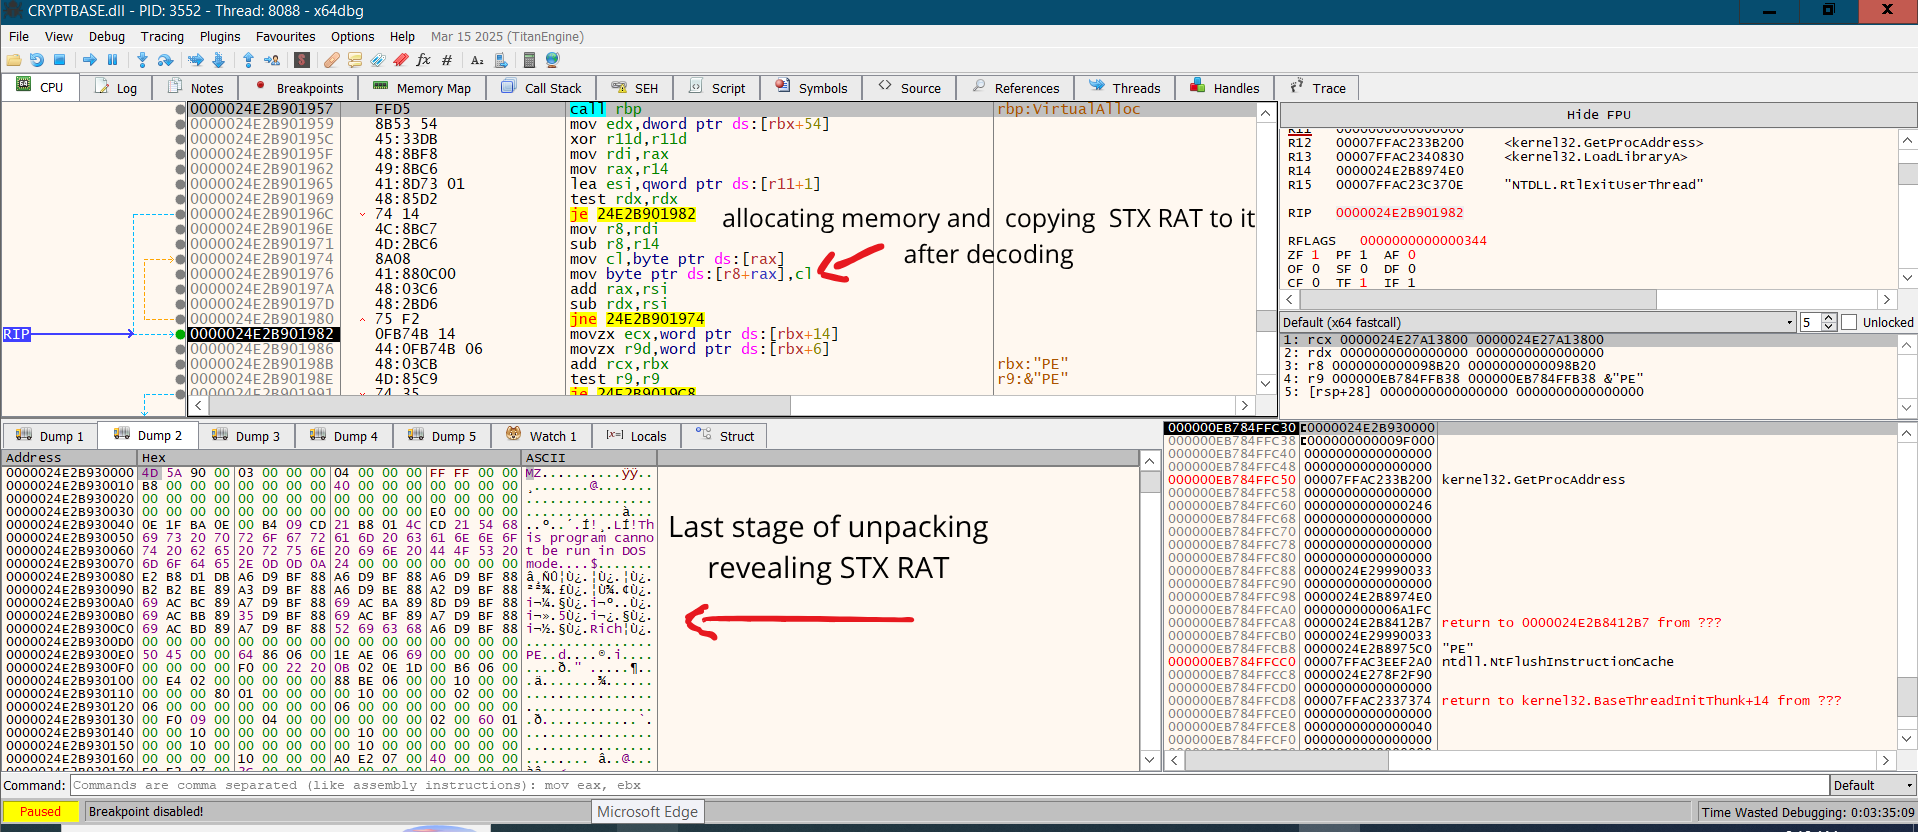
Last stage unpacked in memory
Following that, the loader resolves the virtual offsets, processes the Import Address Table, and performs a last tail jump to the original entry point of the RAT.
Hash:52862b538459c8faaf89cf2b5d79c2f0030f79f80a68f93d65ec91f046f05be6
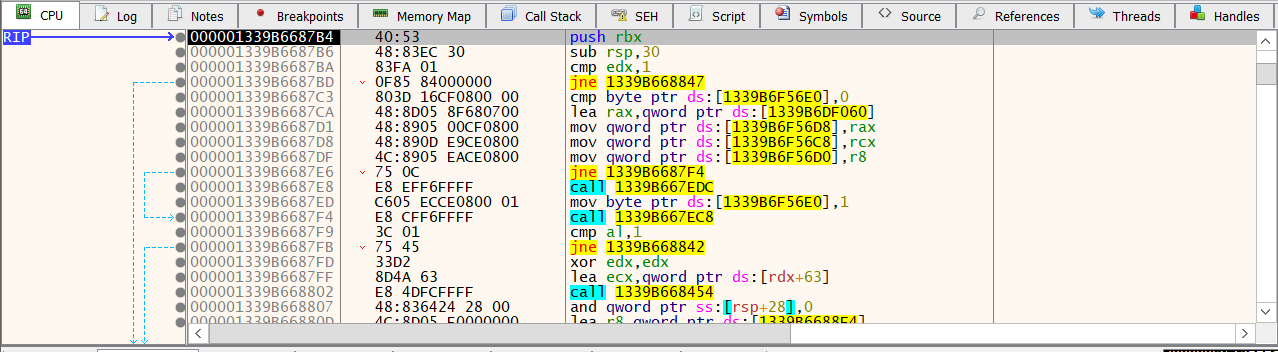
Entry Point of the STX Rat