A Linux malware known as “GhostPenguin” was brough out of the shadows by TrendMicro after being undetected in VirusTotal for more than four months using AI-powered threat hunting.GhostPenguin is a C++ backdoor that has a lot of capabilities like full remote shell access, comprehensive file system manipulation, and encrypted C2 communication over UDP.
more details on that malware can be found in their blog post : https://www.trendmicro.com/en_us/research/25/l/ghostpenguin.html
In this post, I will go through a full detection lifecycle of that malware using ELK SIEM.
Threat Detection Lifecycle
While i am trying to walk through the full threat detection lifecycle, keep in mind that I am running this in a home lab environment. In a real-world setting, phases like Triage and some sub-phases require deep knowledge of the specific organization environment (like knowing which servers are critical or which developers have authorized bypasses or even other detection requirements that is waiting to be worked on ). Since I’m doing it solo here, I will skip some steps in the threat detection process.
1-Requirtments Discovery
Description (What needs to be detected ?):
Implementation of a new detection for the “GhostPenguin” Linux backdoor recently identified in the wild. The detection should focus on identifying the backdoor’s C2 communication patterns, and any associated file-system artifacts on Linux endpoints.
Evidence (supporting artifacts):
- Process Indicator: Creation of a file named
.tempin the user’s home directory (used by the malware as a way to store its process ID). - Network Patterns: Outbound UDP traffic over port 53.
- Shell Activity: execution of
/bin/shor spawned from non-standard parent processes.
2-Investigation
in this phase, we are aiming to convert the detection requirements to more technical requirements.
Data Source:
Since we know that the malware writes an important file to the home directory of the user running the malware → /home/username/.temp and it communicate with c2 server through udp protocal, we need
1-File creation logs
2-network packets logs
detection indicator types:
| Indicator Type | Requirement | Detection System Requirements |
|---|---|---|
| Static | Detect new file creation on user’s home directory | file creation logs can be tracked |
| Behavioral | Detect the c2 communication of the malware to the c2 , in early stage where the malware tries to register itself to the c2 and be waiting for command to execute on the infected machine and while that being happen, it sends heartbeat constantly every 0.5 second | UDP packets can be logged and inspected for payload . |
validation criteria:
For the sake of our case study, i have vibcoded the very same c2 server that the malware supposed to communicate with, replicating the C2 behaviour and sending the expected data back to the malware.
The full setup is like that:
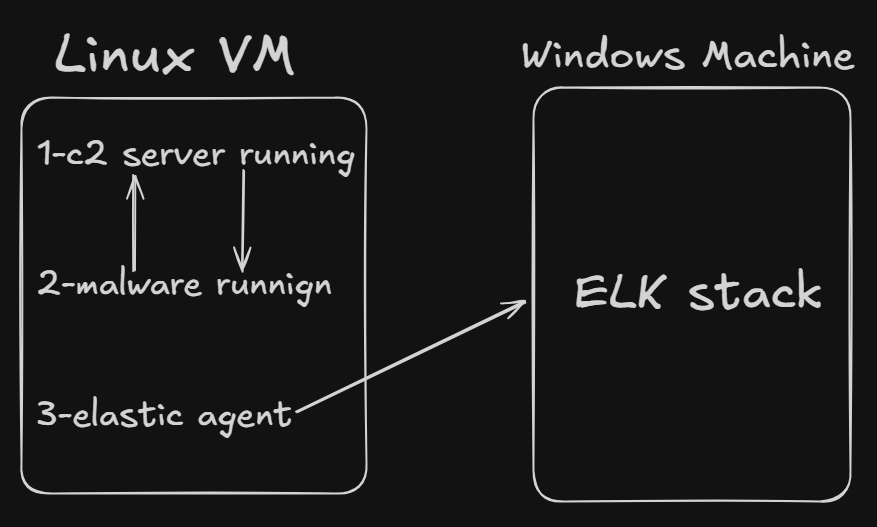
Linux VM :
1-Elastic agent installed
2- Has the fake c2 written in python running on it.
3-has the malware running
I also added a dns rule that forward every traffic going to the read c2 server “65.20.72.101” to fake c2 on the same machine :
iptables -t nat -A OUTPUT -p udp -d 65.20.72.101 --dport 53 -j DNAT --to-destination 192.168.65.130:53
notice that, the IP address of my linux machine is “192.168.65.130”
Main windows machine :
I have on it ELK stack running with an fleet server, and the linux agent enrolled with file integrity monitoring and network packet capture integrations.
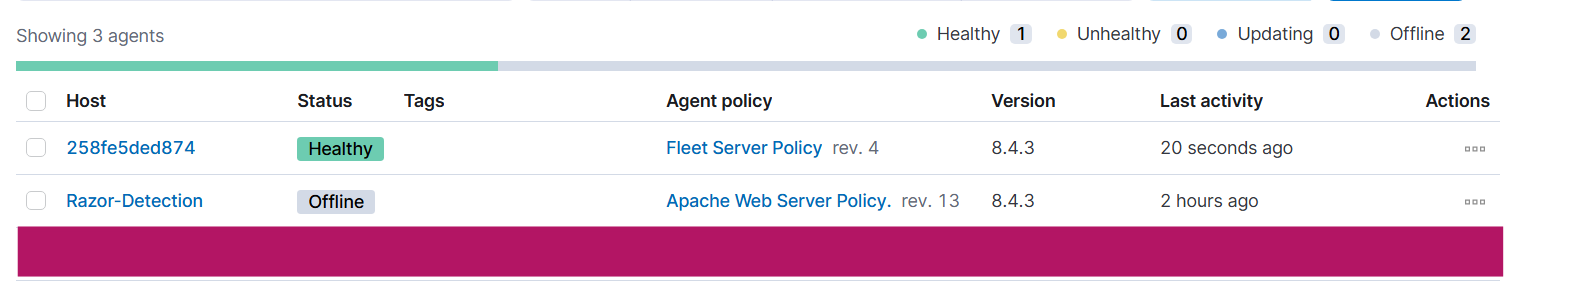
Fleet server and linux agent (”Razor-Detection”)
Current Stack for detection
now the problem is that, the packetbeat which included in the network packet capture integration, captures only the headers of the packet, like the src and dst ips, that is not enough for our detection that aims to detect the specific TTPS used by the malware . We would need a Next Generation Firewall to perform deep packet inspection.
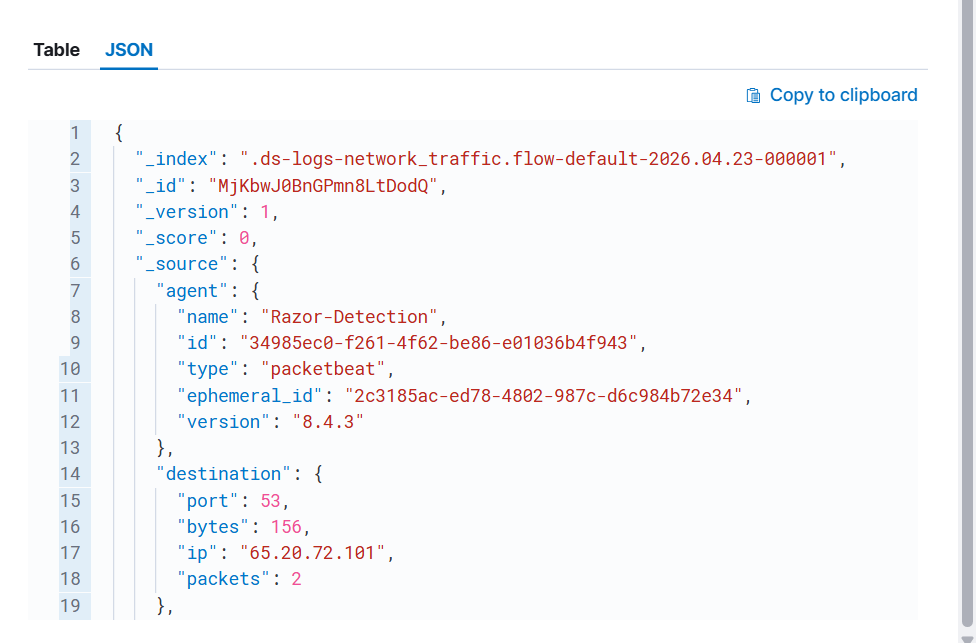
sample of network packet logs captured from malware communication, but it has no packet’s payload
I chose another way to accomplish this: I added logging functionality to the C2 server to log every request, including the packet’s payload, in a JSON format to a file on the disk. After that, I added an integration named “Custom Logs” to ship the file containing the JSON logs on the Linux machine.
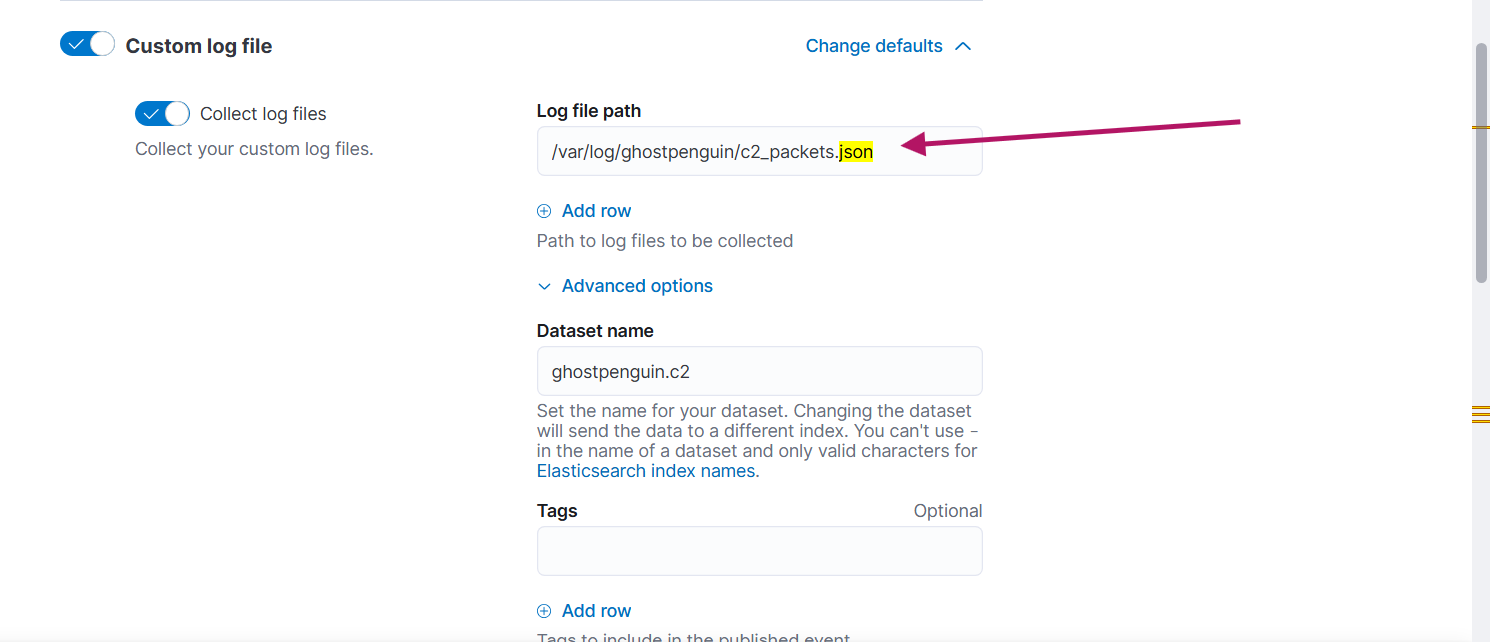
path of the logs file
Here is an example of one of the logs:
@timestamp": "2026-04-24T15:34:02.225681+00:00", "event": {"kind": "event", "category": "network", "type": "protocol", "action": "c2_communication", "dataset": "ghostpenguin.c2"}, "n>
<34}, "destination": {"ip": "65.20.72.101", "port": 44258}, "ghostpenguin": {"raw_hex": "22001d53a33ba094086e500d840d1903cabd04000000000000000000000002000000", "raw_base64": "IgAdU6M7o>
Now we are good to go.
3-development
Before writing the detection logic, we must examine the malware’s primary behavior. While I recommend reading the Trend Micro report for full technical details, the execution flow can be summarized in the following steps:
1-the malware creates a file called .temp in the home directory of the user running the malware
2-malware sends a session request to the server.
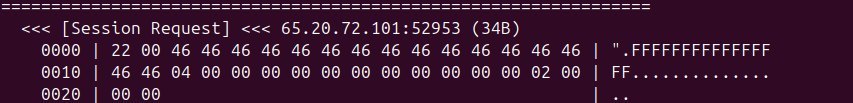
first packet send to c2 server, requesting a session key
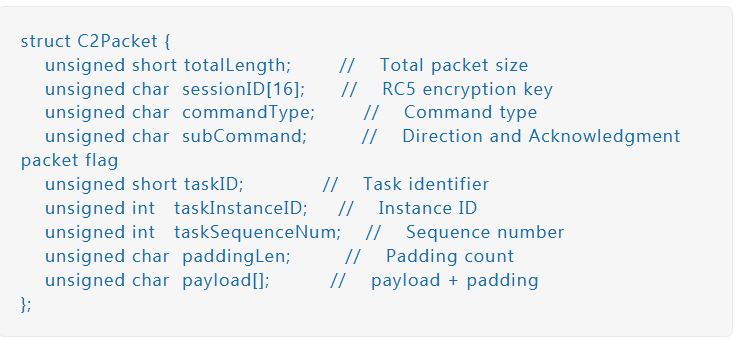
packet structure
source :(https://www.trendmicro.com/en_us/research/25/l/ghostpenguin.html)
34 bytes, UDP, NOT encrypted
 Offset  Bytes                              Meaning
 ──────────────────────────────────────────────────────
 0-1     22 00                              Total length = 34
 2-17    46 46 46 46 46 46 46 46            Session ID = "FFFFFFFFFFFFFFFF"
         46 46 46 46 46 46 46 46            (placeholder = cuz there is no key)
 18      04                                 Command = SESSION_REQUEST
 19      00                                 Direction = Client → Server
 20-21   00 00                              Task ID = 0
 22-25   00 00 00 00                        Instance ID = 0
 26-29   00 00 00 00                        Sequence = 0
 30      02                                 Padding length = 2
 31      00                                 Null payload (1 byte)
 32-33   00 00                              Padding (2 bytes)
3-the malware waits for response from c2 with the session
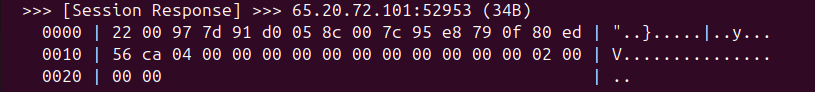
Offset  Bytes                              Meaning
──────────────────────────────────────────────────────
0-1     22 00                              Total length = 34
2-17    97 7d 91 d0 05 8c 00 7c            Session ID = NEW RANDOM KEY
95 e8 79 0f 80 ed 5c ca                    (this becomes the RC5 key)
18      04                                 Command = SESSION_REQUEST
19      00                                 Direction = 0
20-21   00 00                              Task ID = 0
22-25   00 00 00 00                        Instance ID = 0
26-29   00 00 00 00                        Sequence = 0
30      02                                 Padding length = 2
31      00                                 Null payload
32-33   00 00                              Padding
4-now the malware will get footprint of the infected machine and send it to c2 for registeration with task id =1 , means (Status: Initializing))
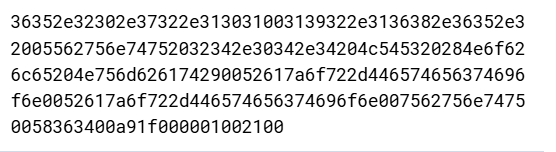
raw packet
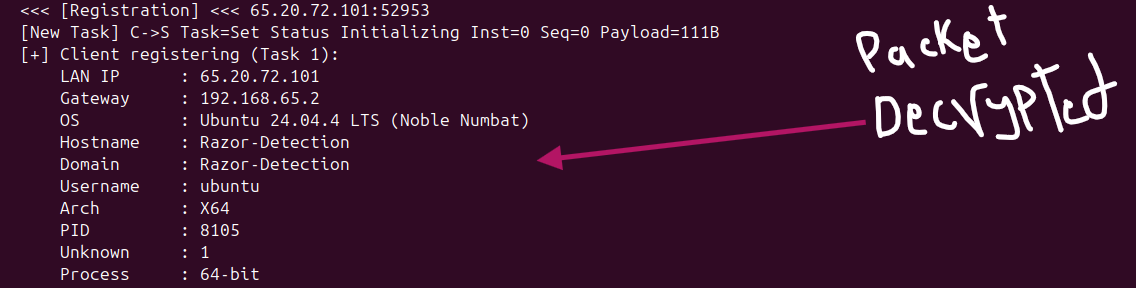
packet decrypted
5-the malware then waits for a packet from c2 server with task id=3, means (Status: Set Status Active)
Registration received. Malware is now ACTIVE.
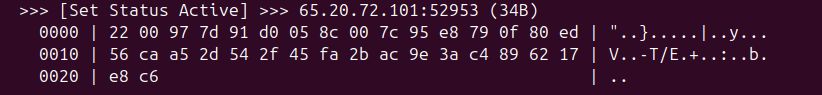
6-Then the malware sends ACK to c2 confirming its status is active

ACK packet sent to c2
7-following that, three threads starting
- ThreadProcHeartBeat    → sends heartbeats
- ThreadProcDataSender   → sends queued results
- ThreadProcDataReceiver → already running, waits for commands
here is example of heartbeat packet:

heartbeat packet encrypted
34 bytes, UDP, ENCRYPTED
Header:
──────────────────────────────────────────────────────
0-1     22 00                              Total length = 34
2-17    [session ID]                       Same session ID
Body (DECRYPTED):
──────────────────────────────────────────────────────
18      00                                 Command = HEARTBEAT
19      00                                 Direction = Client → Server
20-21   00 00                              Task ID = 0
22-25   00 00 00 00                        Instance = 0
26-29   00 00 00 00                        Sequence = 0
30      02                                 Padding = 2
31-33   00 00 00                           Padding
Here is the top-view of malware network communication :
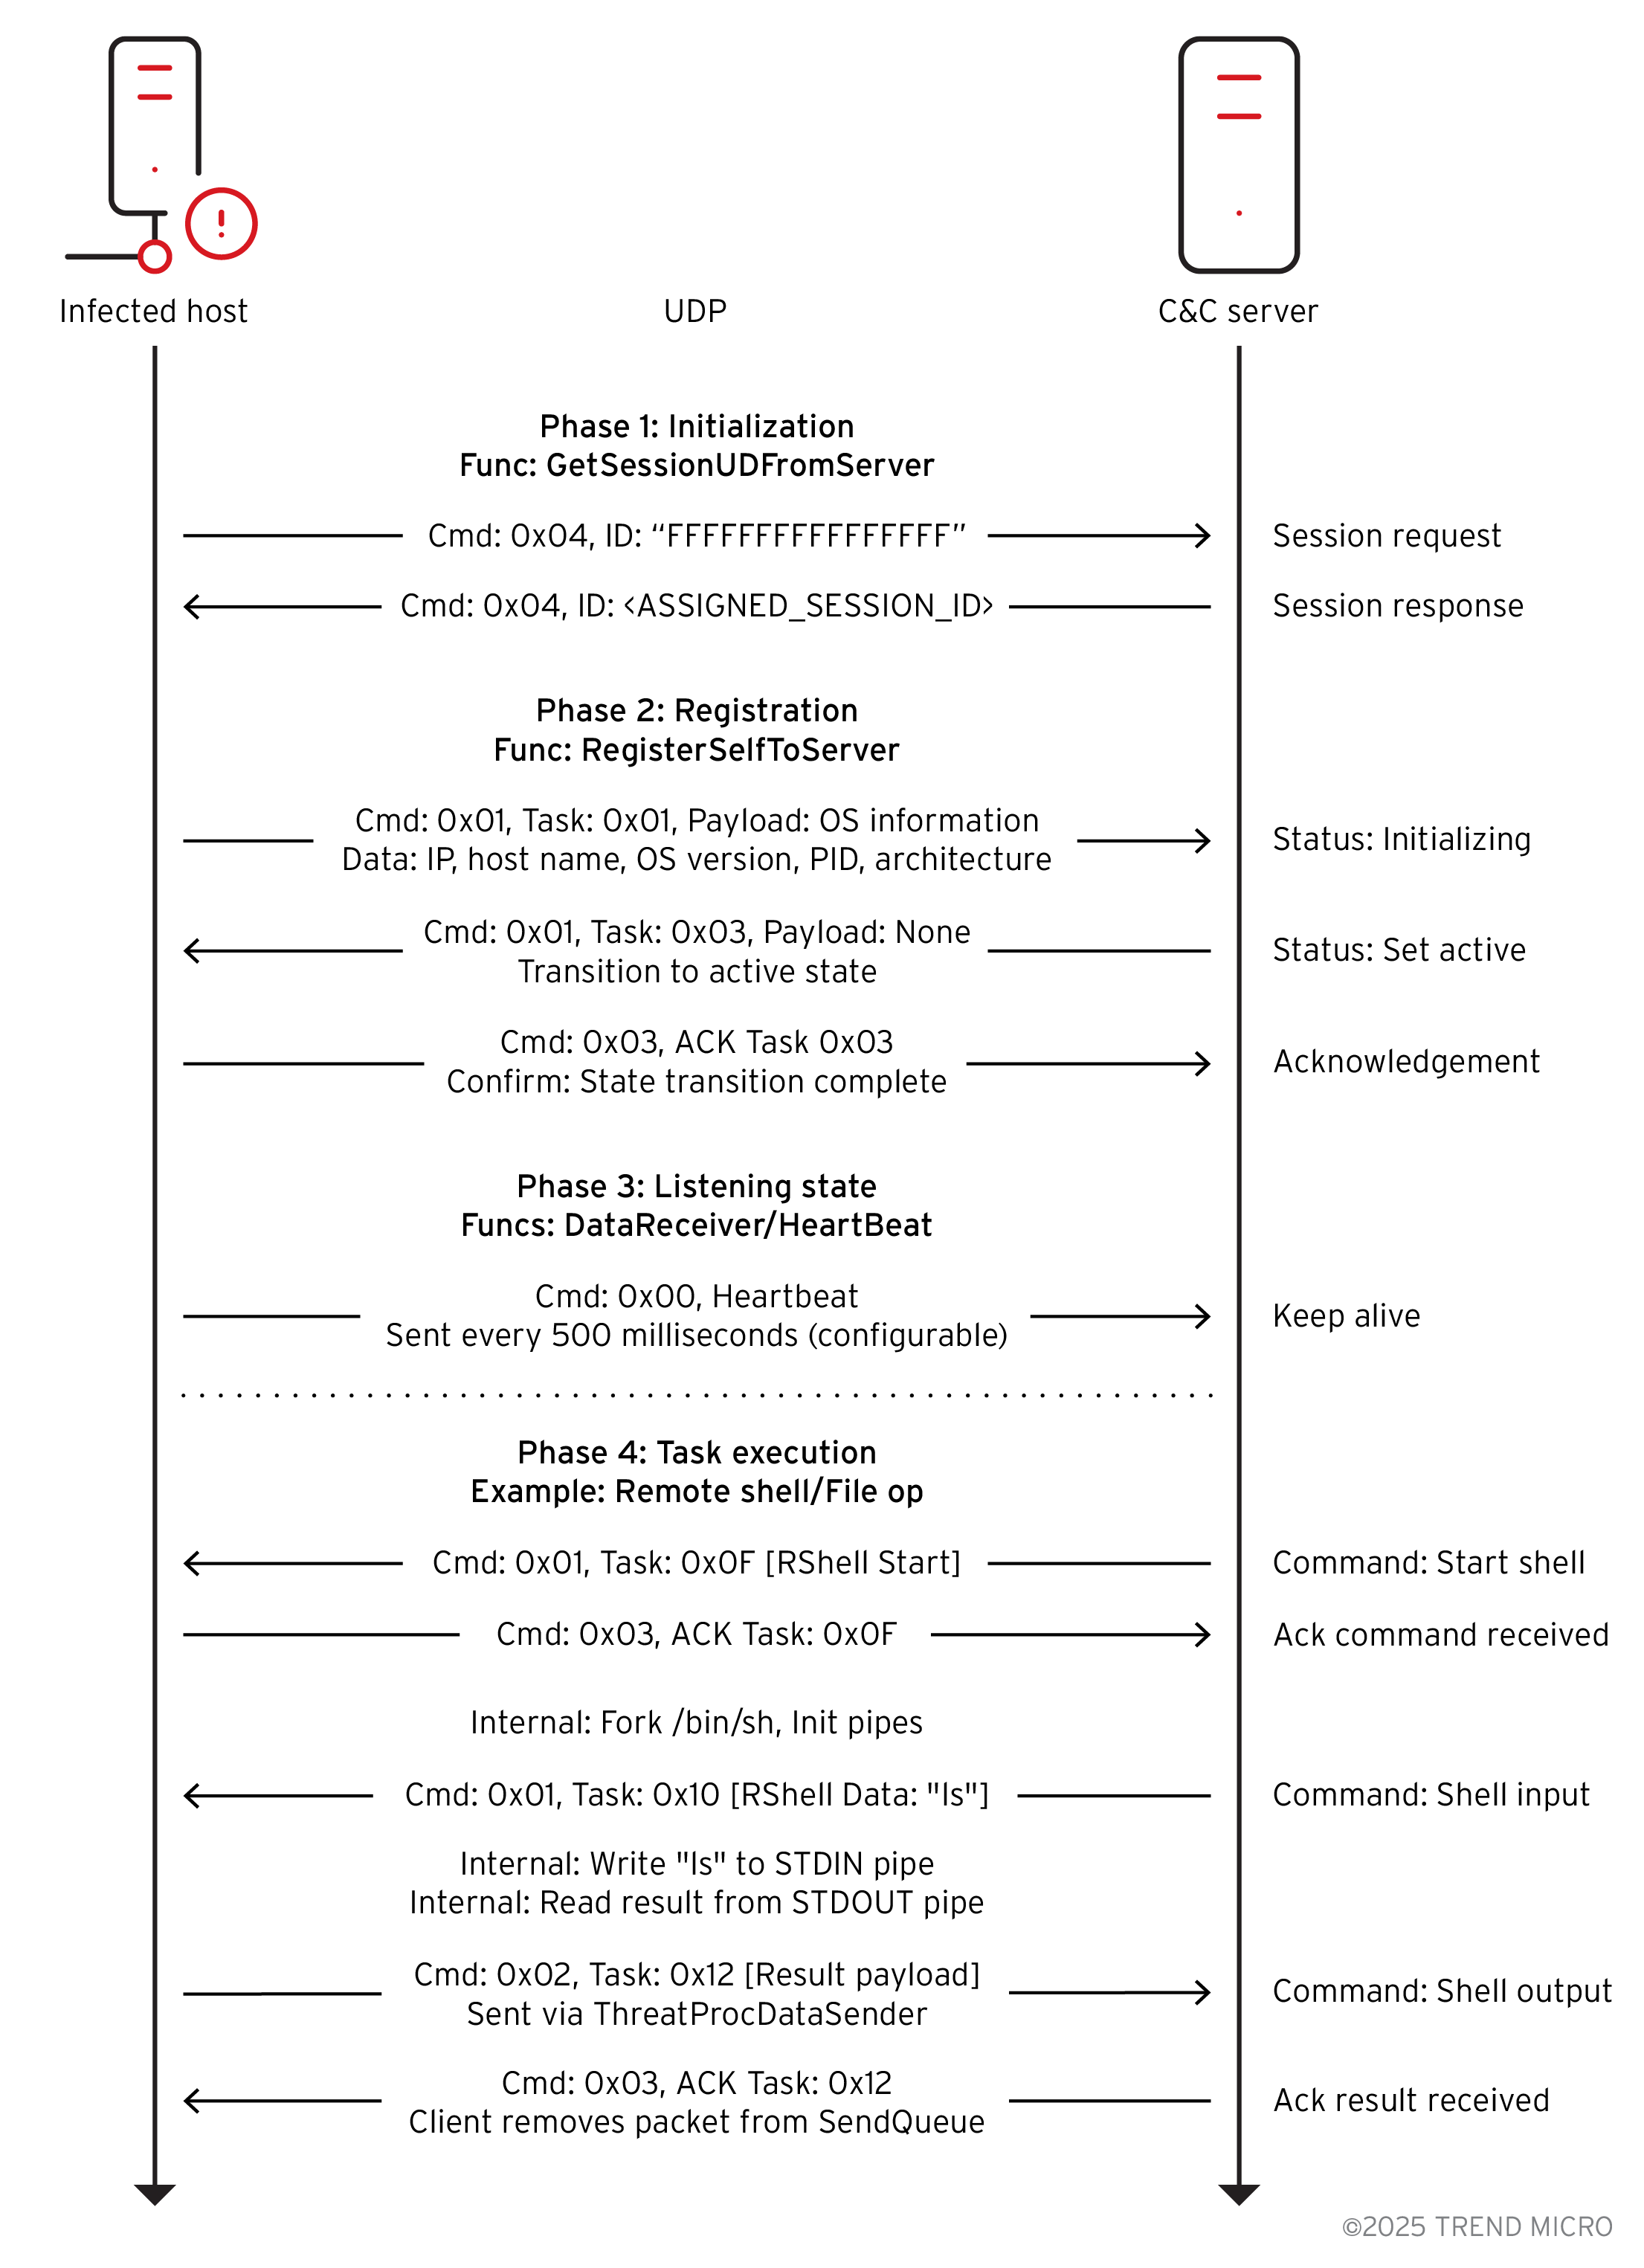
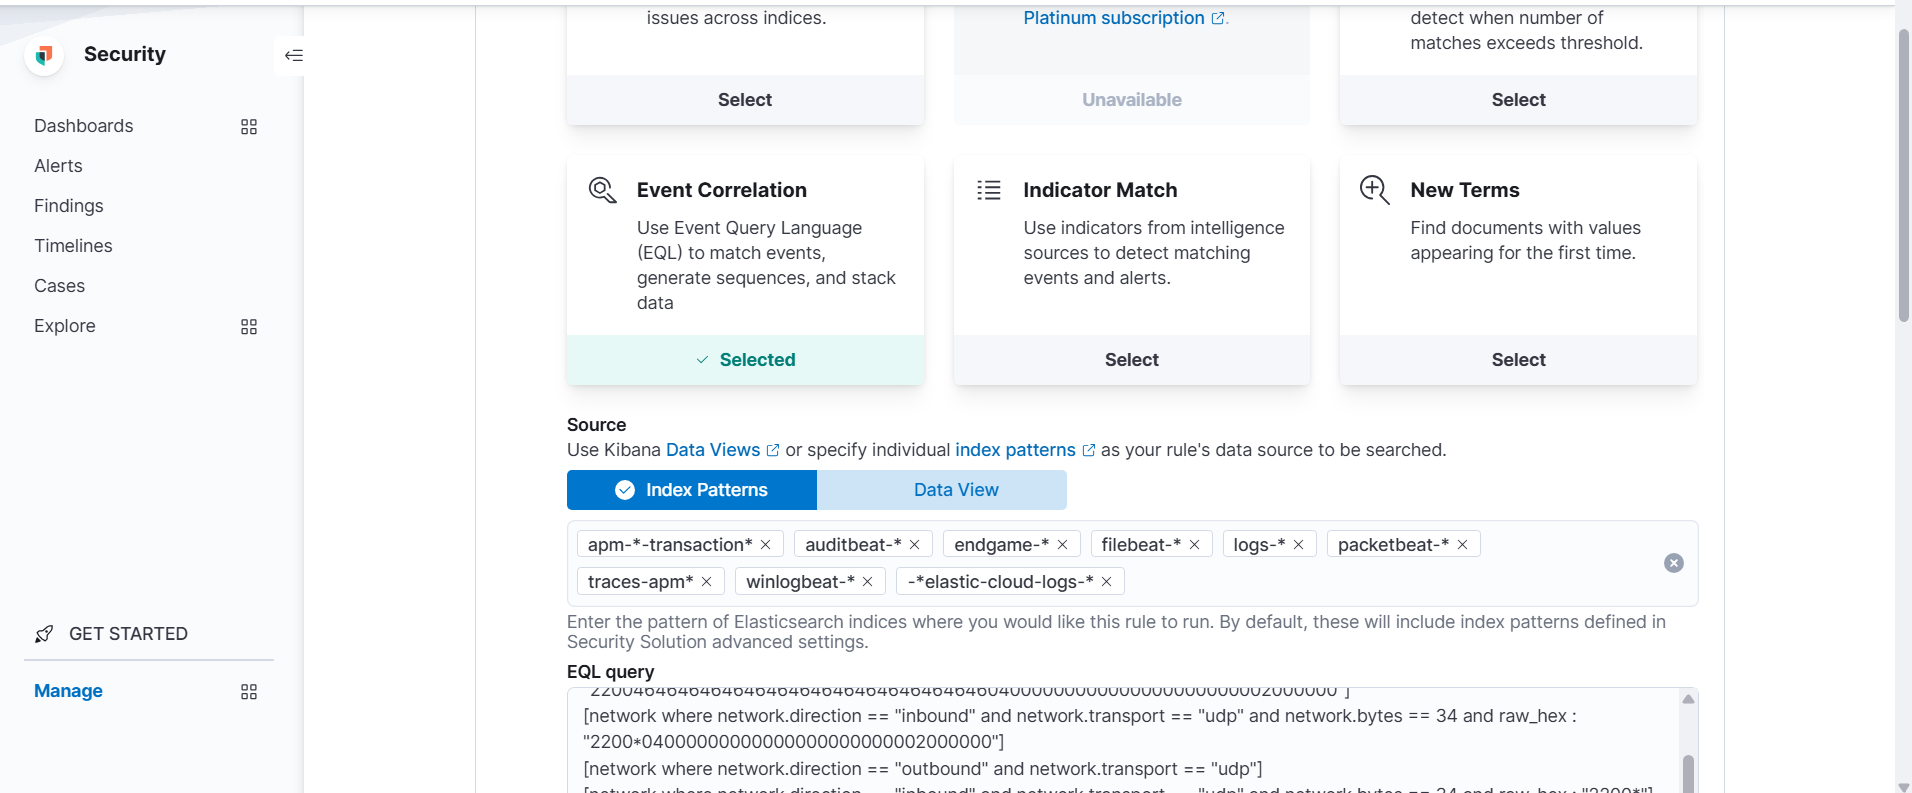
Our detection logic will leverage all these events :
we will be using EQL since it allows for time-series data analyzing which we need.
sequence by host.name with maxspan=60s
[file where (event.type == "creation" or event.type == "change") and file.path : "/home/*/.temp"]
[network where network.direction == "outbound" and network.transport == "udp" and network.bytes == 34 and raw_hex == "22004646464646464646464646464646464604000000000000000000000002000000"]
[network where network.direction == "inbound" and network.transport == "udp" and network.bytes == 34 and raw_hex : "2200*04000000000000000000000002000000"]
[network where network.direction == "outbound" and network.transport == "udp"]
[network where network.direction == "inbound" and network.transport == "udp" and network.bytes == 34 and raw_hex : "2200*"]
[network where network.direction == "outbound" and network.transport == "udp" and network.bytes == 34 and raw_hex : "2200*"]
4-Test and Deploy
Testing phase should be done in isolated enviroment with known good and known bad data.
The rule should be tested on known good data to see whether it will produce high false positive alerts, and tested on known bad data to test whether it will fire or not
Since i have no enough space on my laptop to generate or import high volume of know good data, I will test only on known bad data that we have generated and transmitted to the SIEM.
We choose Event correlation in rule creation tab →
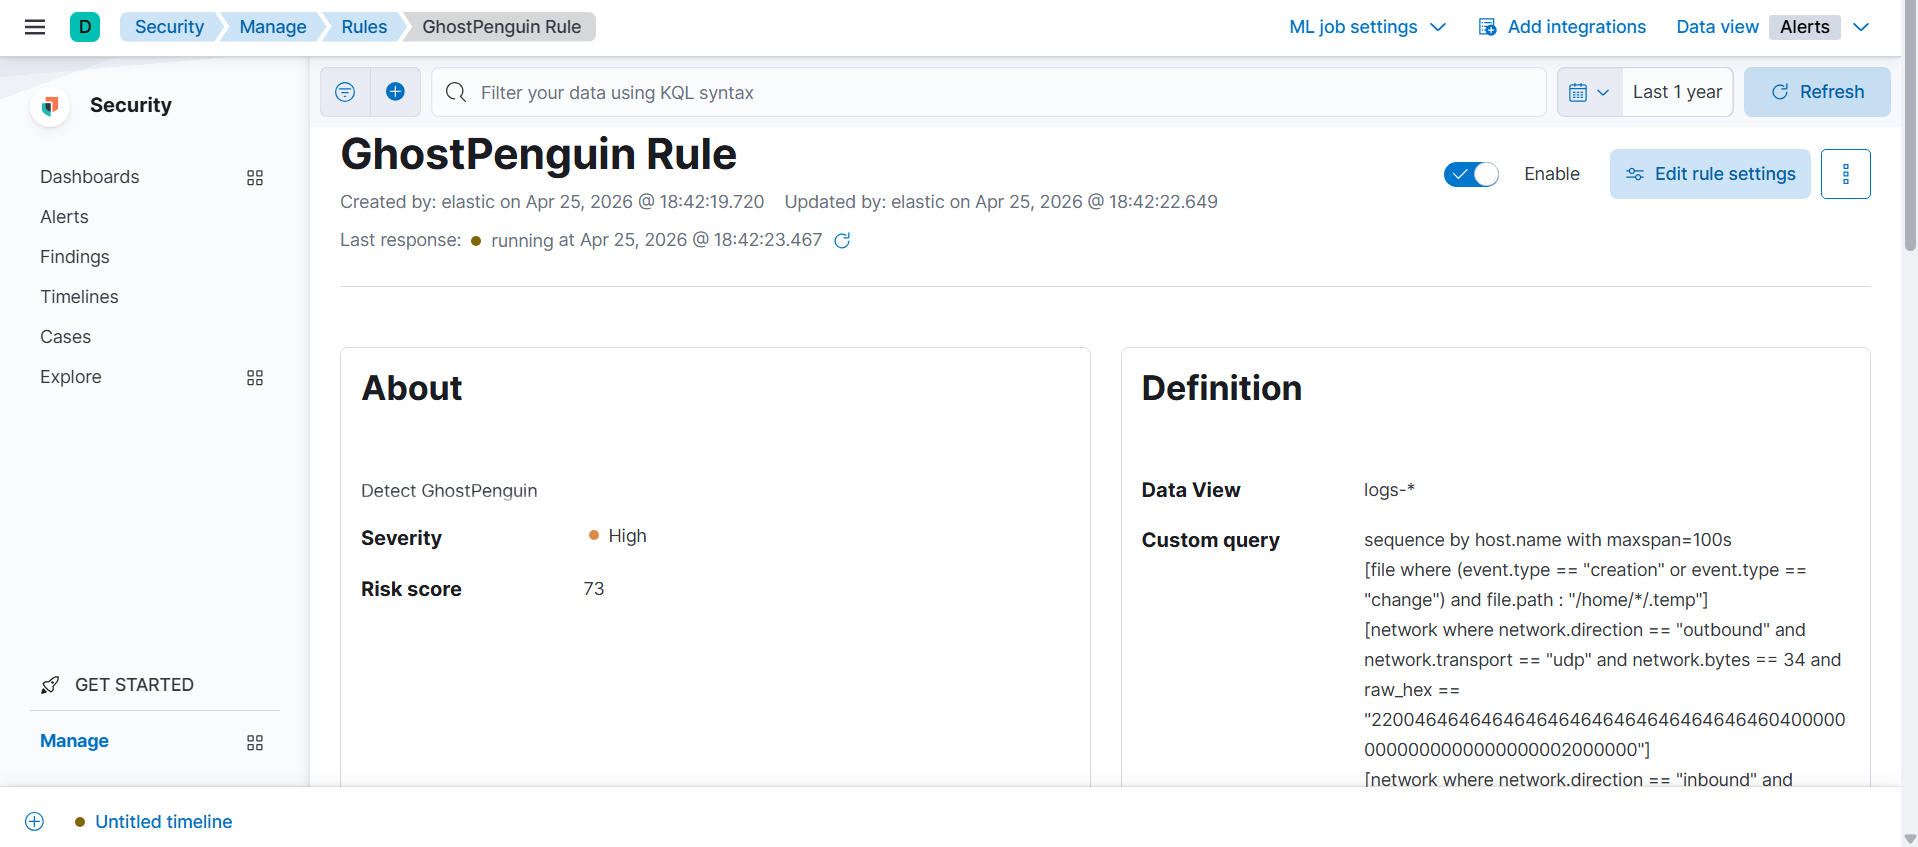
Rule created successfully.

And finally the alert fired